|
Abstract
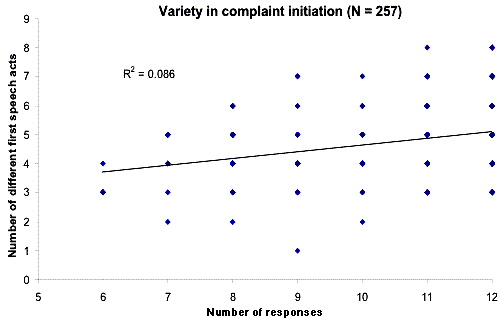
How sensitive are L2 English users to situational differences? The particular stimuli used in interlanguage pragmatics research
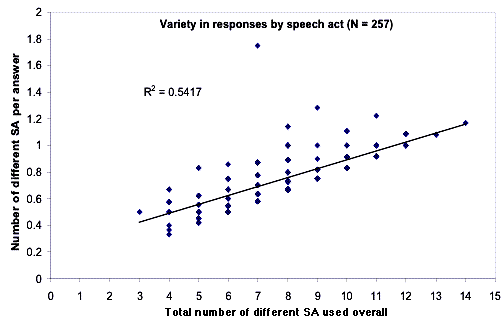
may affect the results. This research examines how three situationally-sensitive measures (word count, speech act features, and
a coded set of actions) vary among a collection of Japanese university-age students when initiating twelve scripted complaints
in English. Data were analyzed using G- and D-studies and ad hoc scatterplots. (For information about G- and D- studies, refer
to Brown, 2005). Situations accounted for less than 3% of variance;
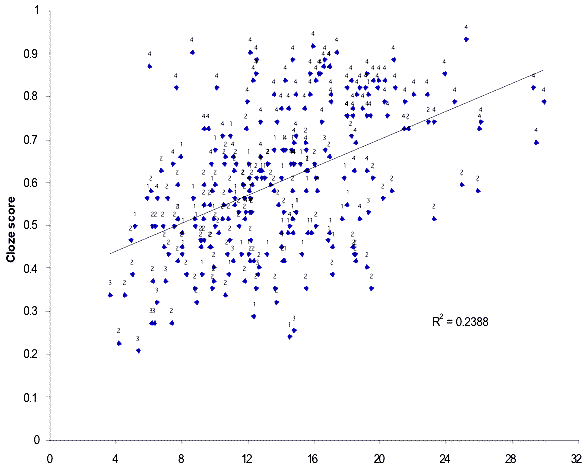
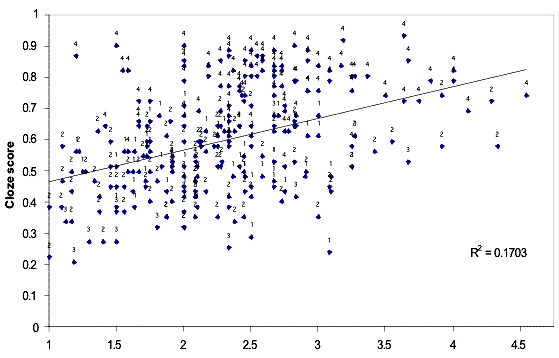
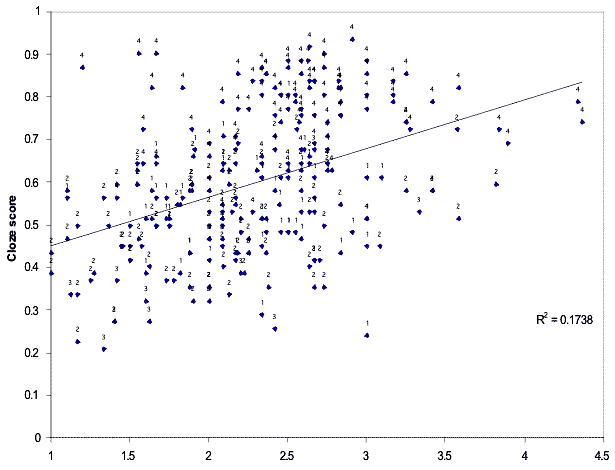
individual x situation interactions had a higher degree of variance. Scatterplots of proficiency test scores against the three
measures showed similar ranges of variation. The data suggest that participant idiosyncrasies may be a reason why L2 pragmatics
performance varies so widely and that the role of situational sensitivity may be less important than previously believed.
Keywords: : situational sensitivity, production questionnaires, pragmatics, generalizability theory
|